An AI-powered ecosystem for autonomous and regenerative farming
Every field decision needs a basis, an action, and a record.
GebField connects field data with an operational plan. AI DataCore helps prepare recommendations and retain the results of completed operations. This gives farms a basis for planning purchases and assessing climate scenarios. A specialist approves critical decisions.

- Observe
- Analyze
- Decide
- Act
- Verify
One operating system. Four layers of work.
Each layer contributes to the same field outcome: understand conditions → recommend an action → execute → verify.
SoilHealth
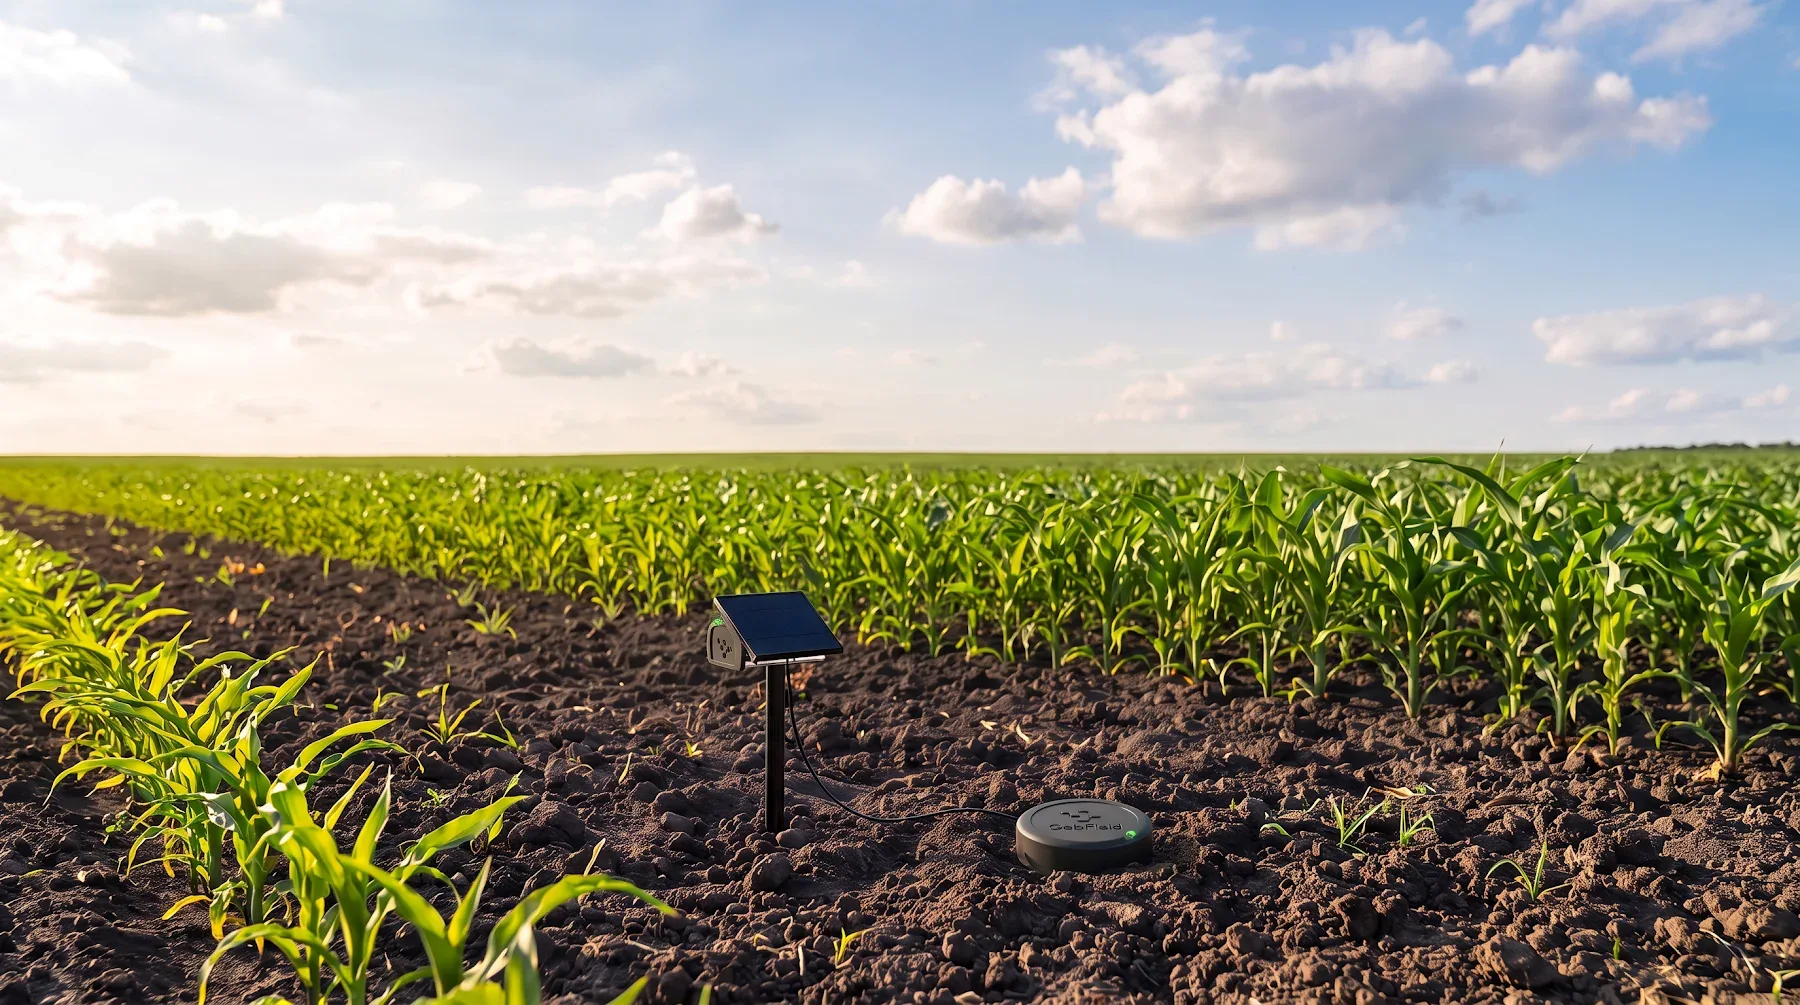
Rapid scanning, laboratory data, productivity maps, and regenerative practices support decisions tailored to specific field zones.
Fleet & Sense
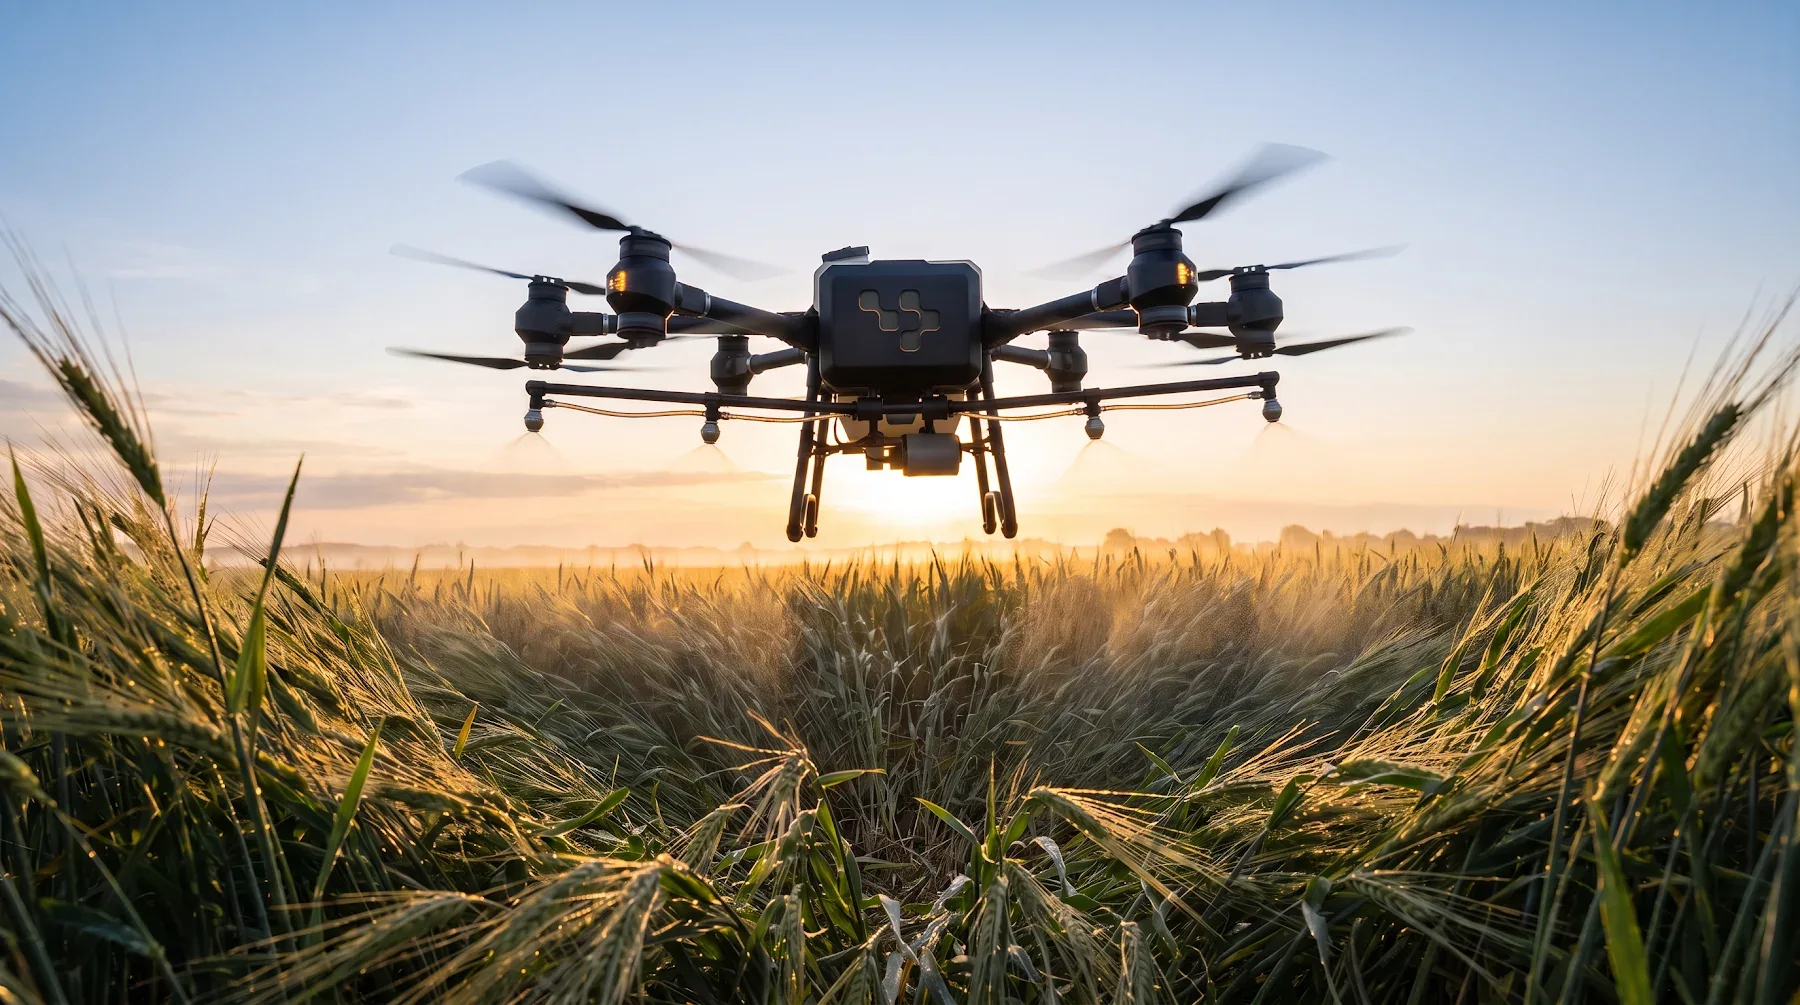
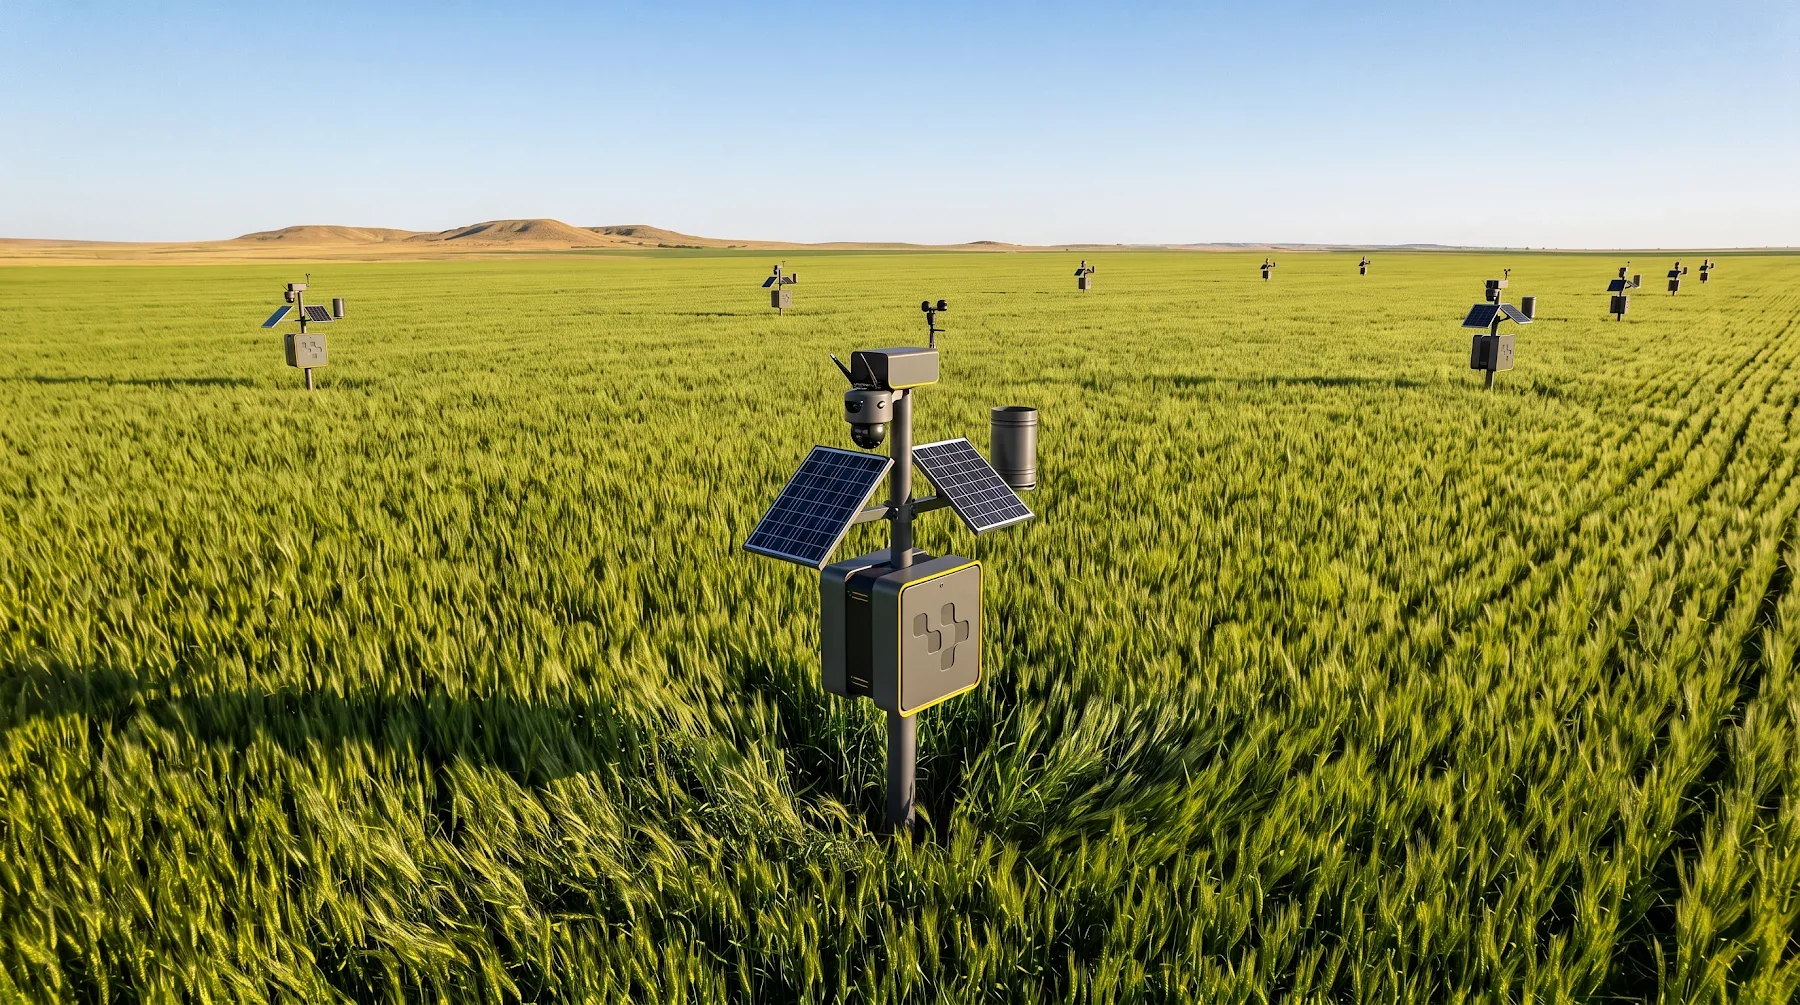
One connected layer for observation and execution: robotic machinery, drones, sensors, and service workflows.
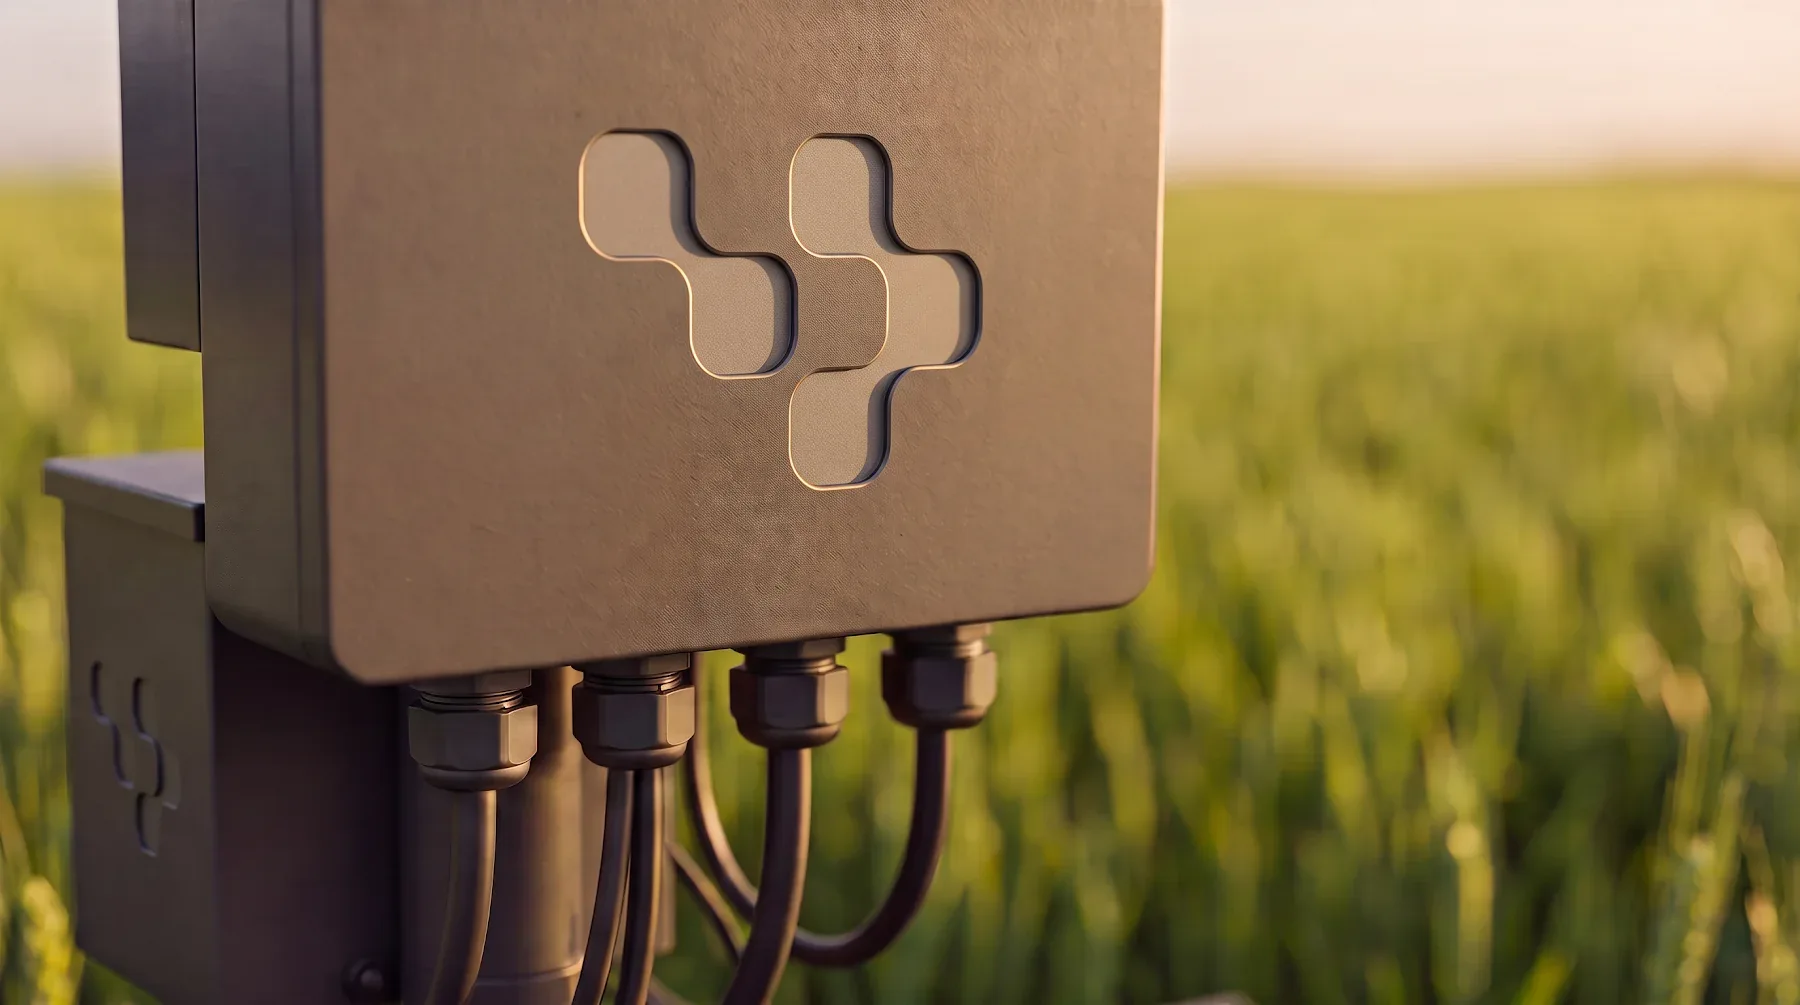
AI Intelligence & DataCore
Data, specialist AI agents, and an evidence base help turn a signal into a verifiable action.
Supporting records
Marketplace, FinOps & Carbon
Resources, services, supporting evidence, and climate data connected to the agronomic plan.
Different specializations. One coordinated approach.
Measuring effectiveness
The effectiveness of GebField solutions is assessed separately for each farm. Results depend on the crop, region, current farming practices, and selected use case.
Before work begins, we record baseline indicators, identify control plots, and agree on the data to collect and how completed operations will be verified. This allows an objective comparison of results before and after implementation.
What can be measured
Resources
Crop protection products, fertilizers, water, fuel
Operations
Cycle time, work rate, share of completed tasks
Field conditions
Zones, samples, sensors, control plots
Traceability
Digital field record, decision history, before-and-after records
Illustrative calculation
for a 247.11-acre pilot
247.11 acres| Resource | Baseline scenario | Pilot scenario | Change across 247.11 acres |
|---|---|---|---|
| Fertilizers | 80.94 kg/acre × $0.50/kg ≈ $40.47/acre | 74.46 kg/acre × $0.50/kg ≈ $37.23/acre | −$3.24/acre −$800 total |
| Crop protection products | 0.809 L/acre × $12/L ≈ $9.71/acre | 0.728 L/acre × $12/L ≈ $8.74/acre | −$0.97/acre −$240 total |
| Fuel | 6.070 L/acre × $1.10/L ≈ $6.68/acre | 5.261 L/acre × $1.10/L ≈ $5.79/acre | −$0.89/acre −$220 total |
| Direct resource costs | $56.86/acre | $51.76/acre | −$5.10/acre −$1,260 · −8.97% |
Operational indicators in the same illustrative scenario
| Indicator | Baseline scenario | Pilot scenario | Change |
|---|---|---|---|
| Data → decision → task → verification cycle | 48 hours | 24 hours | −50% |
| Completed tasks | 80% | 95% | +15 percentage points |
| Operations with a complete digital history | 25% | 95% | +70 percentage points |
This example illustrates a hypothetical change in direct resource costs. It is not a return-on-investment calculation: pilot and service fees, equipment, staffing, data collection, and other expenses must also be considered. All indicators are defined and verified separately for each farm and do not guarantee future results.